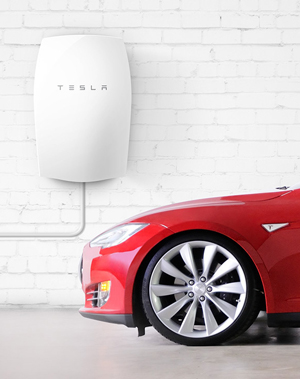
Powerwall in Relationship with a Model S
A few weeks ago Tesla announced a new product line for homes and businesses, the Powerwall. I like many other Tesla supporters applaud Elon’s mission of “moving away from fossil fuels”. I’m excited about the Tesla Gigafactory, which is being built in Nevada to make batteries, because it will enable Tesla manufacturer their own car batteries. I have researched the three different uses of the Powerwall for the homeowner: emergency power backup, grid arbitrage, and enabling a household to be disconnected from the grid. But after a fair amount of research, none of these potential reasons are particularly robust motivators to buy a Powerwall. I am hopeful but not particularly knowledgeable about the economics of this battery technology for industrial applications.
I do not think the economics of the Powerwall will work for the vast majority of homes. One of the largest un reported issues is the variation in solar production throughout the year in the northern hemisphere — a fact that curiously the vast majority of media responses have not mentioned. This huge fluctuation in the rate of renewable energy generation is a problem outside of the new Tesla product. But these fluctuations put a stop to most use of the Powerwall to enable someone to go off the grid completely. The Powerwall however may enable an already off grid home to offset some use of fossil fuels.
The use of the Powerwall for a backup power source is not particularly cost effective or robust, and in most locations better served with a generator. The final use of the Powerwall is to make money with grid arbitrage: buying or making power at lower rates and selling power at higher rates. At a quick glance the arbitrage game may look appealing, but careful analysis looks like in most places with tiered rates, the return on investment is close to ten or even twenty years.
This blog post will discuss in details my conclusions beginning with the problem of the large variation in renewable energy generation throughout the day and year. Then, the post describes the technical details Powerwall, how energy is sold in the US, and finishes describing how the Powerwall works with the three usage scenarios: emergency power backup, grid arbitrage, and off-grid home.
Variable Renewable Energy Generation
As everyone knows including animals, the sun simply does not shine all day long. So solar power only generates energy during the day. Here is an example of my energy use on Sunday May 24, 2015. Both Saturday and Sunday nights at 10pm, the Model S used a lot of energy. Minor amounts of household energy use occurred throughout the day. Between the hours of 9am to 6pm, the solar panels generated energy up to a rate of 0.8145kWh per fifteen minute intervals.
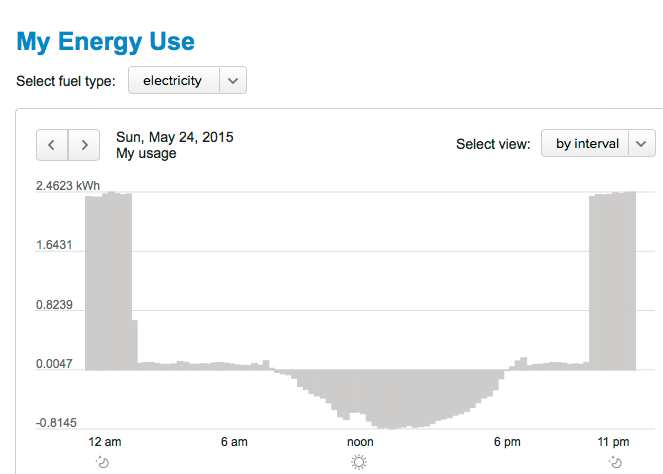
Typical Daily Energy Use Pattern
On May 24 the local power company Pacific Gas and Electric (PG&E) reported the household energy use (minus production) was 21kWh (to be compared to the Powerwall’s 10kWh and 7kWh capacity). The energy use varies wildly and largely based upon how much the car needs to be charged. My energy use is typical with the average household in the U.S., but the average household is not powering a Tesla Model S. In reality my household electricity use is lower than average even with the Tesla.
The next part of the story is to look at the variation of energy generation on a typical solar panel throughout the year. Although I have never collected the data straight from the solar panels, I can show you the chart for the year I first installed the solar panels and did not have an electric car for 10 1/2 months; that solar year was from May 2008 to April 2009. Tesla delivered the Roadster in March 2009.
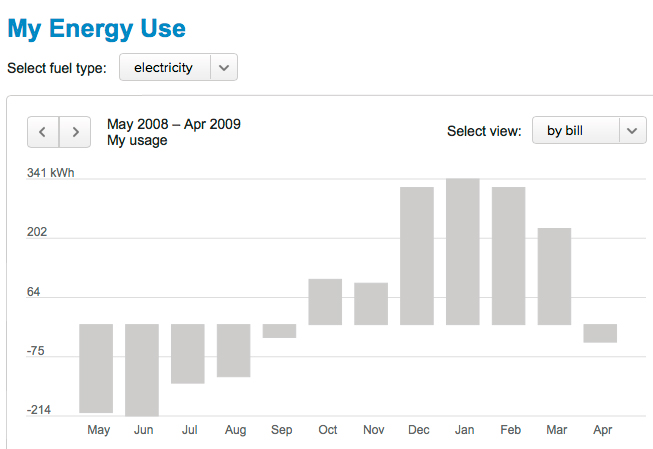
Typical Energy Generation Throughout the Year in the Northern Hemisphere
The variation below is for a climate that is 37.5 degrees North of the equator. This seasonable variation problem would be much less closer to the equator.
Looking at the chart, the usage swings dramatically. During the summer months (approximately April through September), the solar panels generate large amounts of energy. During the “winter months in California” (approximately October through March), the solar panel output is dramatically lower. During the winter months such as January with weak sun because of the latitude more than the amount of sunny days, the usage per month was 341kWh. Seven months earlier and closer to the sun, the usage was -214kWh. I could somewhat accurately estimate the amount of actual household usage per month, but it would only be an estimate. During this year, I produced more electricity than I used and gave away the electricity back to the grid; I gave the electricity back for free as the law in 2009 did not require the monopoly energy company to pay me back. Now the law requires them to buy excess energy for 3 to 4 cents / kWh.
The household energy use is pretty consistent throughout the year. Although there are two air conditioning units that run on electricity, they have only been used an average of three days per year and only for a few hours. The weather here does not get that hot, and the home was designed to match the climate with large overhangs that keep the sun away from the indoors during the summer, and clearstory windows that cool the house down in the evening during the warm months.
Managing the Electrical Grid
Environmentalists typically do not like to talk about the spikes in energy generation in renewable energy. Everyone finds it hard to talk negative about something they are strong advocates for. Solar power can only generate energy during the day and not the night. Wind turbines can only generate energy when its windy. Turbines powered by waves on the ocean floor also are not consistent flat energy producers. To some extent in some climates, these different energy sources are on at different times. Traditionally in California it is windier in the winter than in the summer, although this May has been consistently unpleasantly windy.
Hydroelectric in most instances is considerably more consistent than solar and wind providing a more even power source throughout the year. Old natural gas, coal and nuclear plants can not be turned on and off quickly.
Since renewables are unfortunately not yet widely installed, these problems have not hit the surface in the U.S. Germany’s renewable sources of energy are now at 30% and they have managed to supply power to its users in an even fashion. Their coal power plants can turn off on an hourly basis when not needed and their electricity grid is robust. But the grid in California is not yet as fine tuned as the German one. Renewables just add more complexity to the problem of managing the electrical grid at a large scale.
Tesla’s Announcement
Tesla announced three products:
- 10 kWh Powerwall for the home for $3,000. The 10kWh version is built to be only cycled on a weekly basis and used for emergency power backup.
- 7 kWh PowerWall for the home for $3,500. This version can be cycled on a daily basis and used for grid arbitrage and emergency power backup.
- Powerwall for businesses and utilities. Tesla has not provided much information to the general public about the larger scale uses of the Powerwall.
Tesla lists a single weight of 220 lbs / 100 kg for the Powerwall and a size 51.2” x 33.9” x 7.1” / 1300 mm x 860 mm x 180 mm. The Powerwall has an environmental temperature requirement of -4°F to 110°F / -20°C to 43°C.
Inverter Need
The Powerwall is simply a battery. You cannot simply buy a Powerwall and plug it into you home, you will also need an inverter which costs on the order of $2,000. Batteries and solar panels supply DC current but household current is AC. The inverter converts the DC current to the AC current.
Every existing solar installation has an inverter. I am hopeful but unsure that all older solar inverters are compatible with the new Powerwall. My solar inverter was replaced under warranty and is several years old.
Operating temperature
The operating range maximum temperature is 110 degrees Fahrenheit. Very hot climates such as the desert southwest likely have energy usage that more closely matches the solar panel generation than the San Francisco Bay Area. During the hot summer months, many households in the desert are likely running the air conditioning for most of the day. The temperature limitation of 110 degrees Fahrenheit would require the relatively large Powerwall to be stored in a somewhat cool location – likely not a simple garage or outside wall in the desert. The unit itself is large and over 200 pounds. Most larger homes likely have sufficient wall space in a garage or electrical room for at least one Powerwall.
Installation Costs
Because the Powerwall is a large heavy battery weighing over 200 pounds, you will likely need to hire someone to help you install it. Many localities will require building permits when dealing with electrical changes to your home. SolarCity will install a Tesla battery and an inverter in your home outside of solar for $7,140. Regardless of the location or situation, a Powerwall with or without an inverter will have a non-zero installation cost.
The Energy Monopolies
Home power suppliers in the United States are monopolies. They are regulated by the state government. My local power company PG&E serves most of Northern California. Their rate schedules are quite complicated and changes on a somewhat regular basis.
Energy Rate Schedules
The energy rate schedules are complex. Currently PG&E has eight different time of use (TOU) rate schedules for homeowners; they also offer traditional non TOU rates. In any given TOU schedule there are rates for the summer months and different rates for the winter months. Summer has three different rates: peak, off peak, and partial peak. The winter rates do not have a peak rate only a partial peak and a off peak rate.The time of the day determines peak, off peak and partial peak; but weekends rates are different than weekday rates. The final bill is determined by how much energy you use in the total peak, off peak and partial peak periods.
The idea behind TOU is to charge people more who use excess energy but also charge people more during peak demand times. For example on very hot days in the summer, millions of people are running their air-conditioning causing the electric grid to run out of energy. The TOU incentivizes people to shift optional electric tasks such as laundry towards other times of the day. I have a friend who shifted to a rate schedule that seriously penalizes peak demand usage but has inexpensive rates the rest of the day. To survive in the warmer climate they live in, they blast their A/C during the cheaper rate period, and turn it off during the premium times.
Today most solar customers have TOU schedules that match historic usage patterns. But these historic use patterns are shifting as commuting and lifestyle patterns change and more solar panels are installed. Potentially in the far future as more and more people have installed solar, the rate schedules may change because of the large spike of solar generation in the middle of the day when many homes are unoccupied.
Uses for the Powerwall
Emergency Backup Power
The 10kW battery power is reasonable backup power for a home in California for about a day. This backup power source would not work to charge an electric car but could keep the refrigerator and a reasonable number of lights and electronics for a day. Many households use a lot more than 10kW per day, but these larger use households are likely running air conditioning in very hot climates or have large amounts of electronics.
In my local area in California, a new version of transformers has generally reduced the number of power outages and length considerably over the past five years. Perhaps once or twice a year, we have power outages but are typically back up within 30 minutes or worst case a few hours. Here in CA, power outages are not a big deal. We have learned to not open our refrigerators and take the time to disconnect from the internet.
For a business situation or for someone working at home, emergency backup power will be more important. But I remember fondly the occasional power outages when working in Silicon Valley; sometimes unexpected disruptions to daily routines can be enjoyable if not too frequent.
People living in much more extreme climates and rural conditions can have their power off for days. The small size of the Powerwall does not make it a good choice for running a typical home for several days as 7kW or 10kW is not a lot of energy; perhaps you could use the Powerwall to save the food in your refrigerator but not to recharge your Tesla Model S.
The competition in this space is a simple gas generator that you can get for around $1,000 in the 7kW to 10kW range. Generators can be refilled quickly with more gas and are portable, which expands their usage.
Grid Arbitrage or Load Shifting or Time of Use Offset
A potential use for the Powerwall is to save or buy power when it is cheaper, and then use it when the electric company charges higher rates. There are various terms for this money game: grid arbitrage, load shifting or time of use offset. This financial game can be played with or without a solar system. You can buy or generate power during off peak times, and either use or sell back the power during peak times. With low energy households, the household energy use must be at least 7kW / day or the payback calculations can get even more complex.
Determining the final financial benefit of this approach is very difficult for most homeowners. Some states such as Massachusetts and Washington sell electricity at the same rate throughout the day so grid arbitrage is not available. In Northern California, we have tiered rates throughout the day and throughout the year.
In Europe different countries have different approaches to renewable energy. Germany is leading the way with 30% of its energy is in renewables. Spain on the other hand is stopping all renewable projects even with their abundance of sun and wind. My next post will describe the unique situation in Spain.
Personal Grid Arbitrage
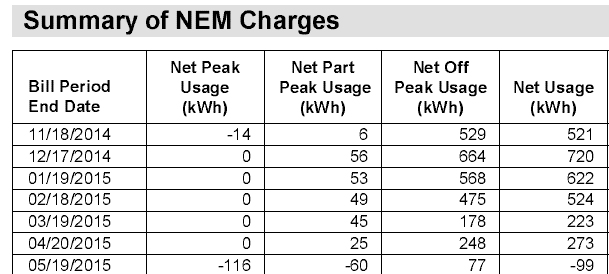
I decided to run the numbers to see if I could make any money with a Powerwall. During six months of the year, I am selling power to PG&E and banking energy to PG&E. Getting very clear information is challenging but I can show the household’s energy usage for the last seven largely “winter” months divided into peak, partial peak and off peak usage. This net energy metering (NEM) charges shows that I never buy peak power. Even during the shoulder months of October and May I am generating enough power with solar during the peak periods.
New Usage Report from PG&E
Each rate schedule has a set of tiered rates. The baseline on the San Francisco Peninsula to stay in tier 1 is 10.9k Wh / day. They use this number and multiply it over the entire billing period so days when a car is charged averaged with all the days of the billing period. For most periods of the year with solar panel energy generation, the house and car never exceeded the baseline tier 1 quantity. I did find a few shoulder months where the data shows a small amount of tier 2 and tier 3 energy during October and November.
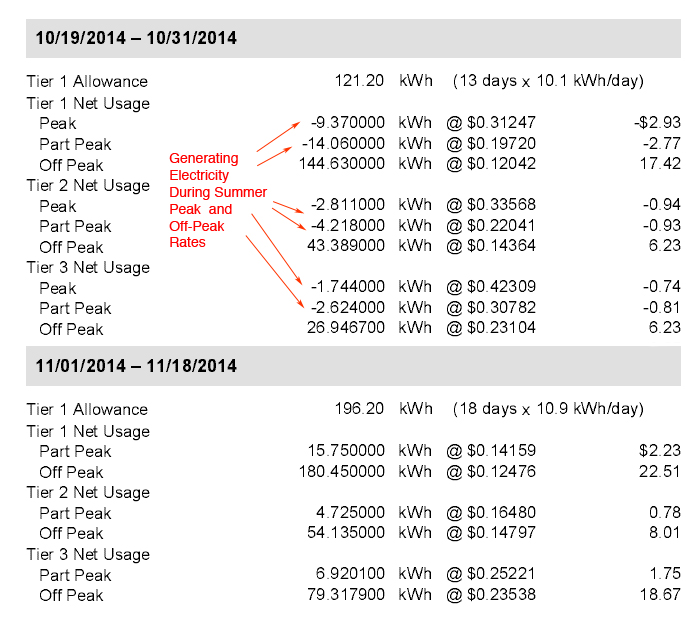
Rates for October of 2014
October is considered a summer month for electricity but the solar panels were still pushing energy onto the grid during the peak and partial peak rates. In November, Tier 1, Tier 2 and Tier 3 rates were all in effect with 8.5% of the energy in partial peak. With my E-6 rates, the difference in the summer months for all tier rates between peak and off peak usage is 19 cents / kWh, and the difference in the winter months is 1.6 cents / kWh.
Ideal Grid Arbitrage Savings
I took the time to figure out how much money the Powerwall could save me if I played the grid arbitrage game in an ideal scenario. If I bought power at off peak rates, filled up the Powerwall, and either use that power during peak times or sell that power back to PG&E at peak rates. I am assuming but am unsure that I will be able to buy power from PG&E, store it in the Powerwall and sell it back to PG&E; many days such as vacations or when the car is not charged I doubt the household always uses 7 kW / day. In this scenario I am not considering any loss of efficiency, assuming my current inverter works seamlessly, a $500 installation fee, a system with no lifetime functional problems, and no opportunity cost for my dollars not in the bank.
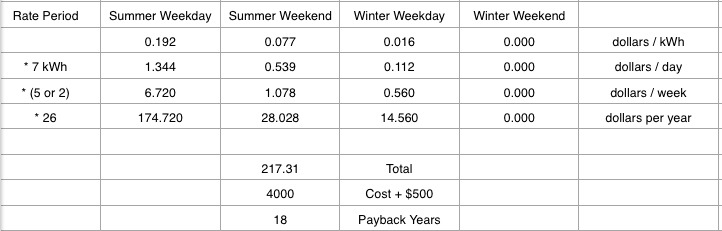
Powerwall Payback in 18 Years or More
During the weekday in the summer, I can net 0.192 dollars per kWh and 0.077 dollars per kWh on the weekend. During the winter those same two number drop down to only 0.016 and 0. Only with very minor exceptions, do I leave the Tier 1 rates. Multiplying this out on a yearly basis, the net game is only $217 per year or 18 years to payback the initial costs in an extremely ideal scenario.
A number of articles have reported that with PG&E you can play grid arbitrage with a rate difference of 30 to 40 cents / kWh. But using this number is not accurate because it assumes you can shift from a Tier 5 peak rate down to a tier 1 off peak rate. These styles of estimates are extremely “optimistic” assuming someone is a very heavy electrical user consistently in the Tier 5 rate can consistently push the purchase down to a Tier 1 rate. In this extreme situation their payback for the Powerwall could perhaps occur in under 10 years, but they would be better off helping the environment by adding more solar panels.
Off Grid
The dream of many environmentalists is to live off grid. The Powerwall is not the tool to enable off grid living. As I mentioned earlier, the solar energy production varies wildly during the year in the United States. This problem would not exist along the equator. But in the U.S. to go off grid with the Powerwalls would probably fill an entire house and / or double the solar capacity.
The Powerwall could help with an existing off grid situation. During the day in the summer months the solar panel excess energy could be saved for electrical needs at night. One or a number of Powerwalls could be used in order to not use the generators and fossil fuels during the summer months in the evenings.
Conclusion
I still admire Elon Musk’s efforts to combat global warming and am looking forward to hearing about progress on the Gigafactory. Unfortunately, I cannot give this product a rave review because today the economics of the Powerwall do not make sense for most homeowners outside of a few exceptions. I’m hopefully that Tesla Energy will be successful in the commercial market with their battery solution.
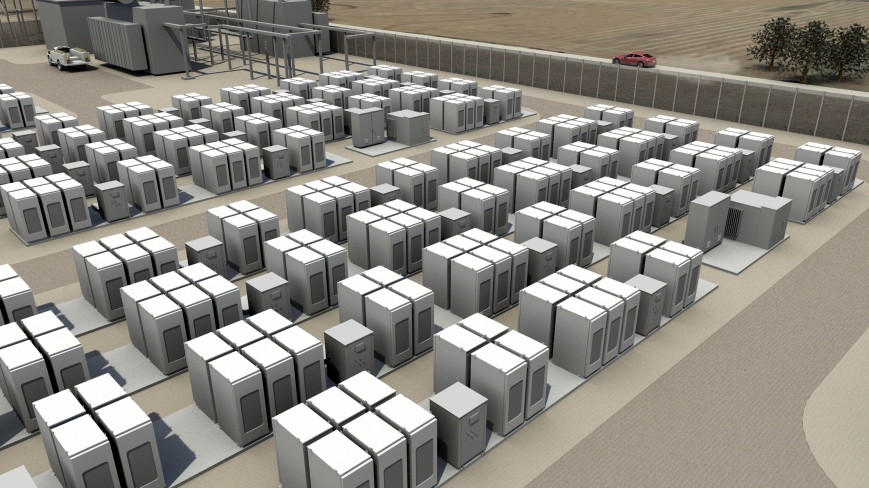
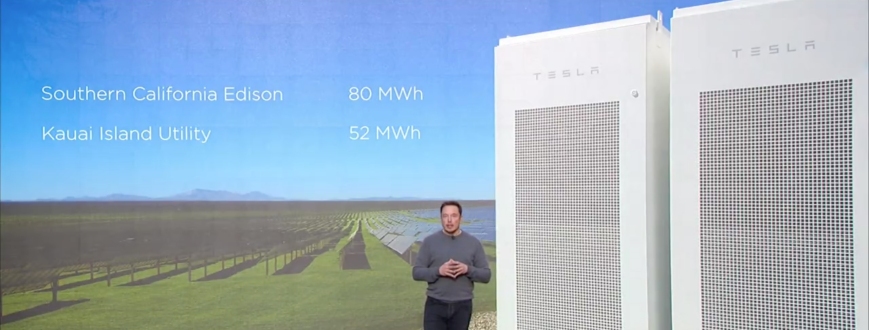
Tesla Image of a Commercial Scale Use of the Technology